Adelaide Housing Market Ticker
After I bought my first rental property, I became more interested in the Adelaide housing market. Over time, I found myself routinely checking housing market indices such as home prices, weekly rents, and vacancy rates. For example:
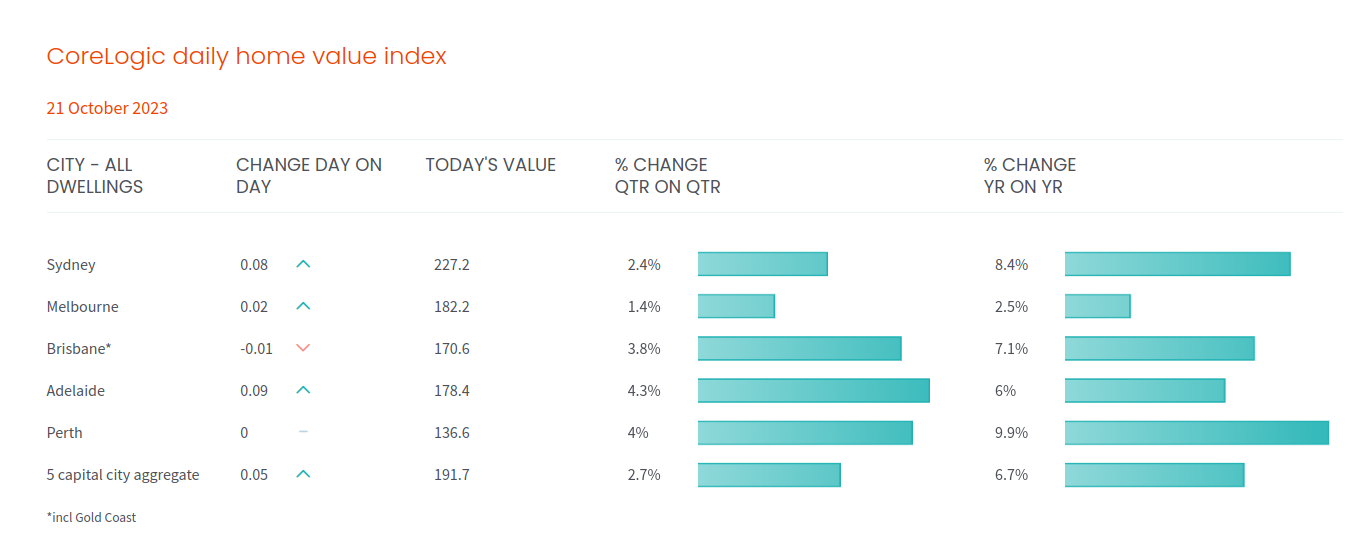
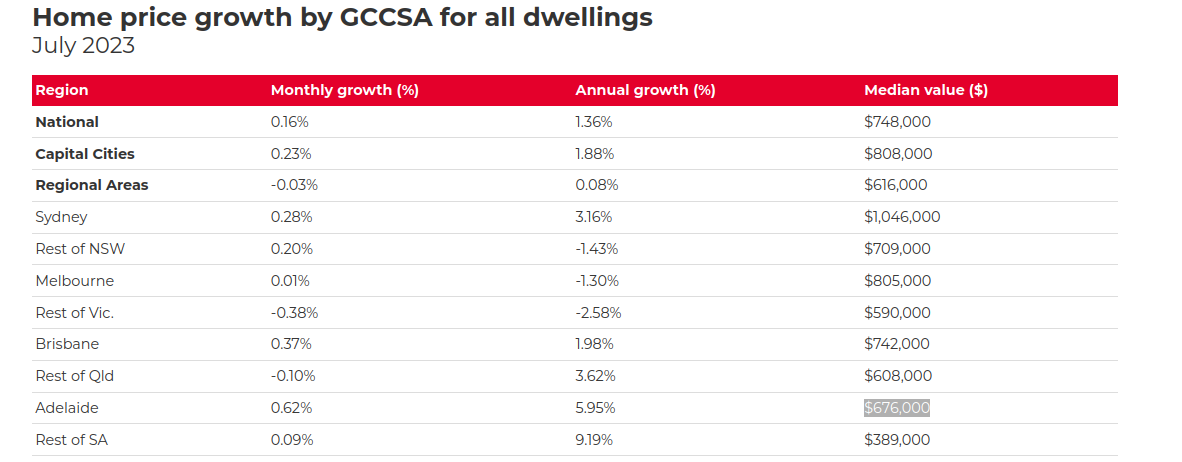
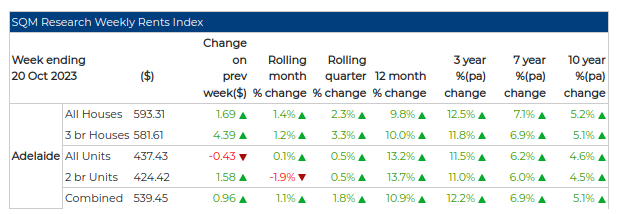
I found myself regularly visiting the same 3-5 websites. So, I decided to build something that would collate all this information, allowing me to visit only one page to get all the new updates. In the end, I built a Twitter (or X) bot that tweets the latest housing market changes:
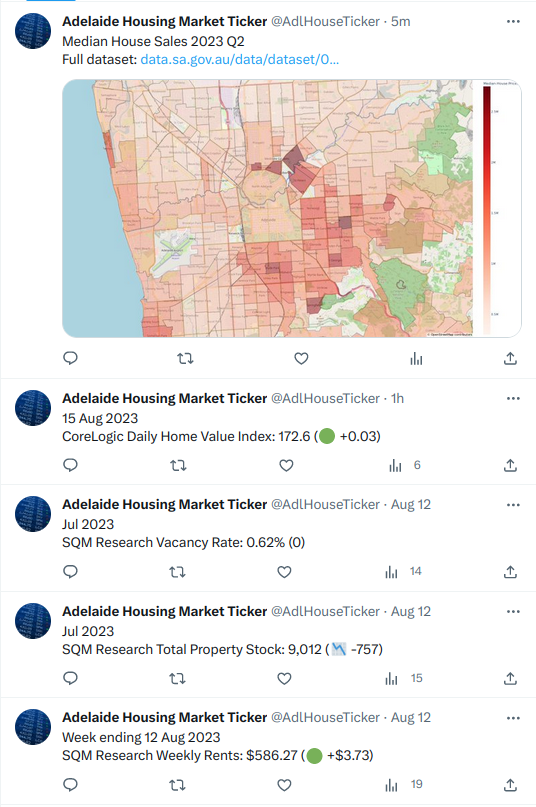 Visit Twitter/X feed >
Project Purpose and Goal
I wanted to create a single place to find housing market data relevant to Adelaide residential property investors. My goal was to keep deployment costs as low as possible (preferably free), covering the following information.
- Home value
- House price
- Rent prices
- Vacancy rates
- Total property stock
Additionally, I wanted to generate quarterly choropleth maps of Adelaide, showing the median house price for each suburb.
Technologies Used
I built this project using Python, AWS Lambda, and Docker.
Python is a versatile language, great for various tasks, including graph generation. It has a rich ecosystem with libraries for almost anything. For this project, I used the following libraries:
- Plotly to build graphs
- Selenium with Python to crawl websites as most indexes were not provided in a convenient format
- Tweepy to send tweets
- Boto3 to upload to AWS DynamoDB and AWS S3
I used AWS Lambda as I only needed daily compute jobs. I wanted to keep costs as low as possible, and Lambda has a good amount of free tier. Other cloud services used were:
- AWS EventBridge to trigger the lambda function
- AWS SNS to notify me of any errors
- AWS Dynamo DB to store any data (picked because AWS provides a good amount of storage for free; otherwise, most other stores would have worked fine)
- AWS S3 to store downloaded files

Finally, I used Docker to set up the environment. This was necessary because the alternative method for setting up the Lambda environment, AWS Lambda Layers, has a size limit of 250MB. Python libraries are sometimes large. Combined with Chrome and Webdriver, the limit was exceeded (821MB in total). So, I built a Docker image and stored it on AWS ECR. Unfortunately, this costs $1.52 AUD per year. Further investigation would be needed to find out how to reduce this to zero.

Problems
There were a few technical problems in building the choropleth map.
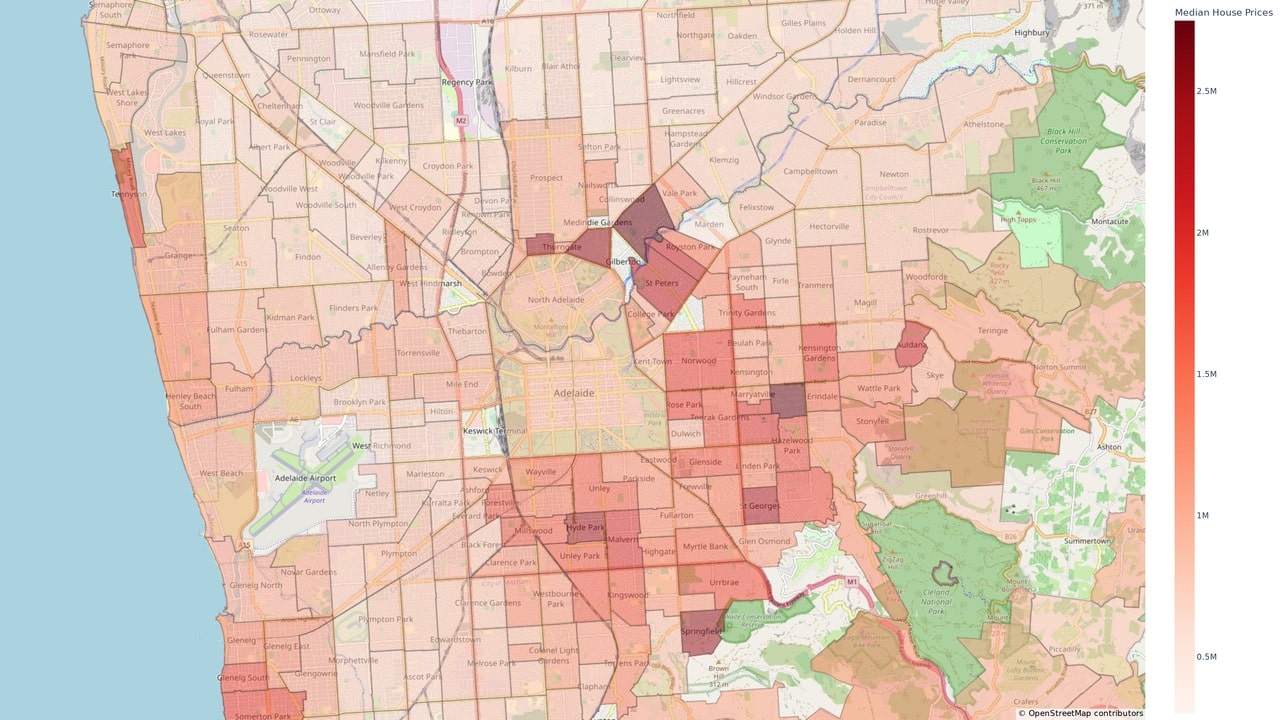
To generate the choropleth map, I needed the boundaries of each suburb and the median house price of each suburb for each quarter.
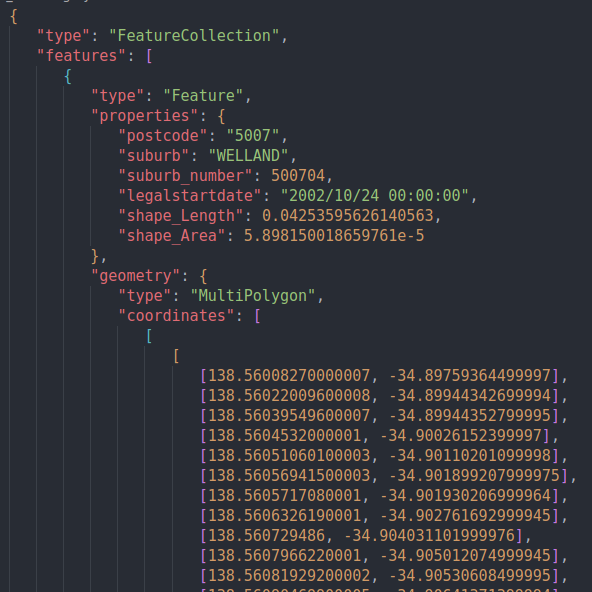
I discovered that the government publishes suburb boundaries in a format called GeoJSON, a JSON format containing geographic information. The GeoJSON file provided by the government was quite large (50MB), resulting in slow choropleth map generation. So, I wrote a script that deleted all the areas outside a 15km radius of the CBD (the area I was interested in), which reduced the file size to 2.2MB.
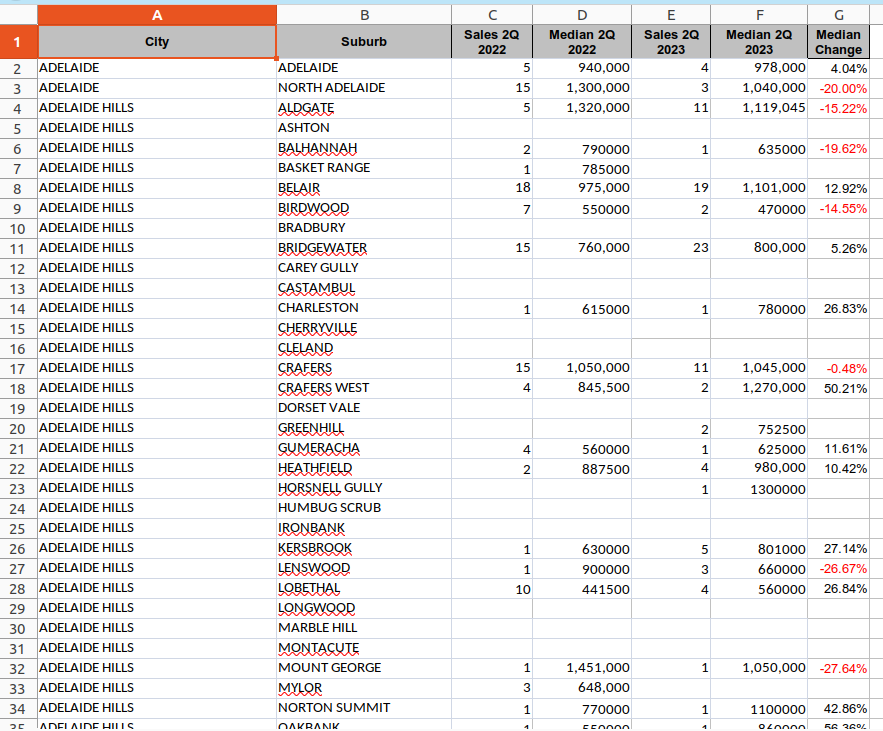
The government publishes quarterly median house sales as an Excel file (see Figure 5). However, this file isn't published on a set date. Instead, it may be published anywhere from 1 to 4 months after the quarter ends. So, I needed to account for this. I ran a monthly job to check whether the median house sales had been published. If it had been published, I would download the file, build the Cholorpleth map, and then upload the median house sales to S3. If this file had already been uploaded to S3, the next monthly job would not need to run again. If the house sales weren't published, we would wait another month.
Another challenge was matching up all the versions between Python, AWS Lambda, Chrome and Chrome Driver. AWS Lambda runs on Amazon Linux version 1 or 2, depending on the Python version. Some Chrome builds don't work on Amazon Linux 2, and the Chrome Driver must match the version of Chrome. AWS Lambda's ecosystem is still immature, so it was a bit of trial and error to make it work. I ended up using Python 3.7, Headless Chrome 86, and Chrome Driver 86, which all ran on Amazon Linux version 1.
To Wrap Up
Overall, I'm happy with how this project turned out. I managed to learn some new things:
- About GeoJSON and the different types of tooling around it. It's an elegant standard with a good ecosystem around it.
- How to build docker images which run on AWS Lambda.
- The ecosystem around AWS Lambda is still fairly immature.
There were some other features I didn't have time for:
- More graphs, or maybe quarterly/weekly snapshots.
- Operating the application for free. It's probably possible but requires further investigation.
- Ability to opt out of certain indexes.
But overall, I achieved the project's primary goal, and might revisit these features in the future.
Let's Build Together
Whether you're looking for an engineer, have a question or want to connect, feel free to reach out at: